Scripting Curves In Blender With Python

This tutorial introduces how to edit curves in Blender with Python scripting. In the following, we’ll look at how to
- render a curve;
- convert a curve to a mesh;
- distribute objects along a curve;
- adjust movement with F-curves;
- move objects along a curve;
- create a curve with multiple splines;
- influence modifiers and particle motion with a curve;
- work with curves and animation rigs.
Blender supports both Bézier curves and Non-uniform rational basis splines (NURBS), but we’ll work with the former only. For those who want more background on this curve,
offers a history in An Ode to the Bezier Curve. To learn how they work by drawing them, The Bézier Game is a great resource. Surfaces are a related topic, but will not be covered here. Nor will text and fonts be covered, although each glyph in a font can be represented as a curve.
While technical in character, the underlying aesthetic goal of this tutorial is to explore the foundations of curvilinear and, by extension, organic form. As the image, left, by Ernst Haeckel illustrates, curves are found throughout nature. Not only do organisms have curvy bodies, but they move in curves.
This is a follow-up to a primer on creative coding in Blender, and so will presume a certain level of familiarity with creative coding in Python. Those who prefer to learn scripting from videos may instead enjoy Tamir Lousky’s Generating, automating and processing 3D graphics with Blender’s python API. This tutorial was written with Blender version 2.79.
Render a Curve in Cycles
We first add a primitive Bézier circle to the scene (manual, Python API). By subdividing a curve and introducing randomness to its control points, we place in the scene a coil which can later be trimmed and edited.
When creating any primitive, the enter_editmode parameter is helpful if we need to edit the object’s data immediately following. In this case, to create new points on the curve through subdivision, we need to be in edit mode. When finished, we return to object mode with ops.object.mode_set.


To view the curve in the Cycles renderer, we append the following to the end of the previous code snippet:
This is equivalent to adjusting the geometry of the curve in Blender’s graphical user interface (GUI).

Next, we modify the bevel and taper of this curve. A closed loop is created to describe the bevel, while an open curve will describe the taper.
If taper and bevel are applied to an open curve with a start and end, rather than a closed loop as above, the option to use fill caps is handy.
Convert a Curve to a Mesh
We can also convert a curve to a mesh (manual, Python API), then take advantage of modifiers to mesh objects, such as skin (manual, Python API).
Create A Mesh Loop

To create the folded ring-like form above, we write the following:
Instead of using vertex_random, we drill down into the spline contained within the curve, into its knots (Bézier points), then the left- and right-handle for each knot. As we’ll explore later, the co, handle_left and handle_right fields of a Bézier point are vectors, each with an x, y and z component.
We often control a for-loop with a range; we do this to make our code easier to convert to other programming languages (e.g., Java, C#). Due to the frequency of loops in creating Blender meshes, those interested in condensing the code into idiomatic Python are encouraged to research list comprehensions. For example,
The modulo operator, %, is different in Python than other programming languages. For example, in JavaScript, -2 % 6 evaluates to -2; in Python, to 4. This helps when looping through arrays either forwards or backwards.
After skinning the mesh created from the curve, we add a subdivision surface modifier (manual, Python API) to smooth its appearance. We then stretch the mesh with the simple deform modifier (manual, Python API).
Fill a Closed Curve
Instead of drawing a tube along the curve, we could use a closed loop to describe a bounded area, then fill in the area with a mesh. First, we set the curve’s anchor points and handles.
In preparation for later code, we import the Vector class from the mathutils module. To create a vector, we provide a tuple, such as (0.0, 0.0, 0.0), to the vector’s constructor. A key feature of tuples is that they are immutable —values in a tuple are read-only, and can’t be reassigned. More can be learned about them here.
To better understand the difference handle types make to a curve, four variations on a star are shown below. More information can be found in the documentation (manual, Python API).


The handle type we choose depends on the kind of shape we’d like to create. 'FREE' gives us the most latitude; however, we need to calculate a Bézier point’s handles manually. 'VECTOR' handle-types help with shapes consisting entirely of straight lines, while 'AUTO' helps with smooth forms.
Next, we convert the curve to a mesh. The four points coded above draw a Valentine’s heart.


Looking at the mesh in edit mode, we see its topology is less than ideal. The face initially created by edge/face add (manual, Python API) is an n-gon. The face is converted from an n-gon to triangles (manual, Python API). Next, the symmetrize (manual, Python API) function mirrors the result. Faces are converted to quadrilaterals where possible. After this, solidify (manual, Python API) and subdivision surface modifiers are appended, but not applied. To smooth the edges of the heart the faces are inset (manual, Python API).
The concavity in the top-center of the heart causes much of the trouble. For example, if we inset the edges of the heart too far or too many times, the faces created shoot out-of-bounds. Instead, we change our approach, relying on the valentine’s bilateral symmetry; we need to draw only one convex half.


We then convert to a mesh and use the grid fill tool (manual, Python API). Once we have a mesh, we add a mirror modifier and apply it as mesh data.
To achieve the bulbous, organic looking heart in the render above, we activate proportional editing, manually select four symmetrical faces on the heart’s verso and recto, then scale on the z-axis.
Distribute Objects Along a Curve
A sequence of objects may be distributed along a curve at least two ways: with modifiers, and through Blender math utilities.
With Modifiers

With the array modifier (manual, Python API), we don’t have to worry about the number of cubes we need to create; we simply fit the needed number to the curve. The array of cubes can then be set to the curve’s path with the curve modifier (manual, Python API).
The displacement of each cube in the array corresponds to the deformation axis: we move 1.25 units on x for each new cube. We add a bevel modifier (manual, Python API) for polish. The width of the bevel is a percentage.


A curve may adopt curve and array modifiers as easily as an object, so simple patterns can be layered. In particular, the curve modifier’s deformation axis (manual, Python API) allows us to experiment with how such figures emerge.
With Python

If we need to position elements along a curve through script, we can use the interpolate_bezier method from geometry in the mathutils module.
This interpolator takes two anchor points as the first and last arguments. The second and third arguments should be the first and last control points (or, the first right handle and last left handle). The number of points to generate is the fifth and last argument. The result returned from the function, stored in points_on_curve in the above code, is an array.
An alternative would be to create a custom function that takes a step in the range [0, 1] as its last argument and returns only one point.
Neither this function nor interpolate_bezier distribute points at equal distances along a curve. Depending on the tightness of the curve’s bends, objects may clump together or spread out. (A discussion of how to create equidistant points in Blender may be found here.) Both functions are limited in that they assume a spline of a curve contains only two anchor points.

To adapt interpolate_bezier for curves with multiple knots, we try out
Since the last knot on a segment of the curve is the first knot of the next segment, there will be overlap. The last point in the result of bezier_interpolate will be the same as the first point in the list on the next iteration through the for-loop. For that reason, we remove this last point from the list with pop unless we’re on the last pair of knots. Two lists can be concatenated with +. For example, [1, 2] + [3, 4] yields [1, 2, 3, 4].
To orient shapes along a curve, we calculate the tangent with the following:

A look-at rotation is then created from the tangent using the vector function to_track_quat. The result is a quaternion, so the rotation mode (manual, Python API) of the object — Suzanne in the following — is switched from Euler angles in the order 'XYZ' to 'QUATERNION'. Blender’s implementation for quaternions can be found in the mathutils module.
This function relies on reference directions for forward and up. Different inputs may be required for different models; in this case, we use -Y for the track and Z for up. As an alternative to the bezier_tangent function, we could find a forward direction by subtracting the current point from the next .
To develop our custom functions further, we create a multi-segment interpolation function that returns a point and tangent. This result is stored in a dictionary; the key by which a value can be retrieved is a string.
This function needs to know whether the loop is closed so the results can wrap around if need be. For open curves, the step is clamped to the range [0, 1]. Because the earlier approach that used curve and array modifiers is so powerful and convenient, this function is more useful when, for example, working with metaball elements (manual, Python API).
Animate A Curve

Like many other objects in Blender, curves can be animated by inserting key-frames (manual, Python API) for a named property. In the following, we animate a closed curve by setting key-frames for its left and right handles. Below, the images of the curve in edit mode illustrate the three ‘poses’ the curve will adopt.


The context’s scene contains references to the beginning and ending frame, and also the function, frame_set, to change the current frame.
F-Curves
The manner by which points on a curve are animated in frames between key-frames may also be adjusted via script.
This adjustment is done through F-Curves (manual, Python API). Stored within these curves are key-frame points, each of which contain information for how to interpolate between them (manual, Python API). The type of easing is also stored here (manual, Python API).


We can observe the difference these interpolation and easing options make if we open the graph editor. In addition to these named presets, points and control handles on the F-Curve may be edited. As an illustration:


To create the above, we list the locations for a cube to visit on a tour. Were we to use linear interpolation, the cube would visit these stops in a straight line.
An F-Curve, unlike a Bézier curve, cannot loop back on itself in time. In addition to the handle types we’ve observed before, F-Curves feature an auto-clamped type (manual, Python API), which prevents overshoot. We simply add random values to the handles using the uniform function from the random module. More on the differences between F-Curves and Bézier curves can be found in this discussion.
Move Along A Curve
With Constraints

Cameras are one of the more useful objects to move along a curve, as the curve allows us to control the tour of a given scene. The model used for this example is Head of a Bearded Old Man, posted by the Victoria and Albert Museum, London to Scan the World.
The camera is instructed to follow the curve by adding a follow-path constraint (manual, Python API). Its rotation is governed by a track-to constraint (manual, Python API). Having worked with the to_track_quat function earlier, we are now better positioned understand the properties of these two constraints.
Setting the follow-path constraint’s property use_fixed_location (‘Fixed Position’ in Blender’s GUI) to True will let us control its position along the curve with a value in the range [0, 1]. The curve around which the camera rotates may also be animated; the follow-path constraint will adjust.
With Python

We can also do this without constraints using the bezier_multi_seg function.
For the render above, we create three key frames for every knot in the curve. The fewer key-frames the animation has to work with, the less accurately the object will adhere to the curve.

To create the illusion of cars in a train, we consolidate object distribution with path following,
in effect creating a custom bezier_interpolate function. By changing the offset parameter as we advance through a keyframe, we shift the train cars along the curve. The period could be thought of as the percentage of the curve the cars span.
Create a Curve from Data (Rather than Ops)
Up to now we’ve used ops.curve to add a primitive to the scene. A more direct way is to create a curve through data. This will give us greater control over the number of knots in a new curve without having to subdivide.
It is considered poor design to change behavior of a function based on a Boolean flag; we have conflated a circle and a curve here for brevity. We next define the two functions which respond to the close_loop flag, append_spline_curve and append_spline_loop.
This is the equivalent of adding a curve primitive to the scene. The major difference is that the above generates a straight line.
This is the equivalent of adding a circle primitive to the scene. Note that a Bézier curve only approximates a circle; for the underlying maths, see Pomax’s Primer on Bézier Curves. A related discussion on approximating cosine and/or sine waves can be found at Stack Overflow.
Since the creation of complex curvilinear forms may involve stitching together arcs, as explored in this Red Blob Games article, and since the maximum arc-length a Bézier curve may plausibly approximate is 90 degrees, the ability to control the number of knots in a circle is important when creating an initial material — a lump of clay, so to speak — to snip apart or otherwise modify.
We next extend this functionality to create star patterns.

To illustrate the possibilities of such a function, we create a sampler:
The number of knots, and therefore points on the star, increase along the z-axis. The y-axis governs the sharpness of the star’s corners. The roundness of the stars increase along the x-axis. When creating numerous samples in a procedural art project, a clear naming convention will help curate our results. In this case, we use Marcus Kazmierczak’s Python String Format Cookbook to mark the rows, columns and layers — padded to three places — for each star. We cover scripting Blender materials in detail in another tutorial, here.
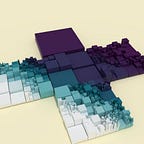
Curves With Multiple Splines
All code snippets above have taken for granted that a curve will have one and only one spline. Some projects, however, will necessitate more than one.
Cut-Outs
When one closed loop lays entirely inside another, and the loops are set to 2D rendering, the inner loop will be interpreted as a cut-out of the outer. This is useful when openings in a mesh need to be arranged according to a symmetry.


When separate curve objects are joined together, the composite object stores them as separate splines. This first example creates separate curves with ops, then joins them.
Continuity and Discontinuity
The Boolean use_cyclic_u we’ve run into above contributes to the idea that a curve is either continuous or broken, with no in-between. Multiple splines facilitate the illusion that a curve may break, then re-establish continuity.

We start by adapting the earlier code that created a circle:
Instead of distributing knots of a closed-loop along the circle’s circumference, instead we distribute splines. We’re long overdue for a function to simplify the setting of key-frames for a curve knot, so we define that next:
If vectors are not supplied to the function, then a key-frame is set for the current values of the knot. To create the above animation, we write the following code:
The first and last key frames of this example are set to the default or rest position. Two key frames in the middle rotate the curves.
Branch Out
Blender doesn’t support branching curves, but we can work around this by placing knots on separate splines at the same location.

If we convert such a curve to a mesh, the topology will be less than ideal, however. When a curve with no geometric rendering is converted, the mesh will be just vertices and edges. Even when curve two knots overlap, the vertices in the resultant mesh will not be merged or connected with an edge. When a curve with geometric rendering is converted, the mesh will likely have intersecting faces, highlighted in red, below-right.


If manual cleanup is necessary, vertices can be merged in edit mode with Alt + M. Trouble spots in the latter case may be spotted by turning on Mesh Analysis in the 3D view’s properties panel and selecting ‘Intersect’. We can automate vertex merging with the BMesh module.

We start by appending a branch to an existing curve.
This finds a direction for a new spline to travel based on an axis-angle rotation. Since the splines created are straight lines, we add variety with a randomize function.
We provide the option to leave the origin and final knots unchanged. This ensures that knots on separate splines still overlap each other at junctures. The noise module in mathutils provides randomization functions above and beyond those to be found in random. Included in this module are random functions geared toward vectors. To generate a network like the above, we use
The BMesh module is great for those who wish to work at a low level as much as possible but need higher-level functions usually accessed through ops. The workflow involves creating a BMesh object from mesh data, editing vertices, faces and edges, then converting back to mesh data. Editing functionality is stored in four sub-modules: operators, types, utilities and geometry.
Because the skin modifier wraps the curve in a box-like form, we append a smooth modifier (manual, Python API) followed by a subdivision surface for finesse. Depending on the extremity of the randomized rotations that created the curve, manual editing may still be necessary. One alternative to skin would be to distribute metaball capsules along the curve.
The algorithms which generate the branching form above are for illustrative purposes only. Lindenmayer systems (L-systems) are a great subject of study for more sophisticated approaches. Michel Anders has created an add-on for creating trees which he discusses here.
Unseen Forces
Instead of visualizing a curve, we could let the curve remain an invisible force which influences the formation of other elements.
Vertex Groups

One way to implement this is add a vertex group (manual, Python API) to the objects we wish to influence, then find the distance of the object’s vertices from the curve. A grid of cubes makes it easy to see how deformations operate on a mesh, so we start there:
We could create such a grid of separate objects, cube by cube, then join them together into a single object. It is faster, however, to work at a lower level. To do so, we create mesh data from lists of vertices, edges and faces with the function from_pydata. When we worked with cubes as objects, we transformed them with vectors and quaternions; transformations were animated with key-frames. For mesh data, we use matrices instead. More on this workflow can be found in Diego Gangl’s tutorial series, which begins with Meshes with Python & Blender: The 2D Grid.

By default the grid creation function above creates a single vertex group which contains all cubes. Once a vertex group is in place, it may store weighted numbers. Weights can be manually adjusted in weight paint mode. In the code below, we use a vertex weight proximity modifier (manual, Python API) to paint these weights for us.
Before the curve may inform the proximity modifier, it needs to be converted to an object. Since this object contains vertex and edge data only, the modifier must be informed of that as well. We then feed the information from these weights into a Laplacian smooth modifier (manual, Python API).

Many other modifiers accept influence from weighted vertex groups. Above, we work off a tutorial by Matt Bell, warping the bearded old man from the above camera example. Those interested in calculating proximity between vertices of objects at a lower level may find the KDTree (k-dimensional tree) and BVHTree (bounding volume hierarchy) modules in mathutils useful.
Emit Particles Along A Curve

A curve may also exert influence over the flow of particles. We begin by creating a particle system (manual, Python API).
A cube is used as a blueprint object for the particles appearance. To keep this reference invisible from the camera, we scale it to zero, then ensure that its scale is ignored by the particle system. To prevent the object which emits the particles from being seen, we set use_render_emitter to False.
As explained by CGCookie in How to Animate Particles Along a Curve in Blender (Without Curve Guide), a curve guide limits our options for adding variation to the particles’ motion. The alternative proposed is to leave the type of the force field as Force, then set its shape to curve.
Curves And Armatures
Convert a Curve to an Armature with the Skin Modifier
A quick way to create an armature (manual, Python API) from a curve is through the skin modifier introduced above.

This process does quite a bit on our behalf. Segments of the mesh created by the modifier are assigned Vertex Groups (manual, Python API). The amount of influence a bone exerts on a given segment is governed by the weighting system introduced above.

We can visualize these weights by selecting the mesh created by the modifier, entering edit mode, opening the properties menu (View > Properties or the N hotkey), then checking Show Weights under the Overlays section.
When the circle primitive is converted to an open loop, we lose the last quarter of the circle. To bring the armature to life, we loop through every bone in the armature’s pose, then rotate it by a quaternion.
There are multiple ways to convert a curve to an armature at a lower level. This is due in part to significant differences between the two. An armature is a hierarchy, or tree, of bones, consisting of parent and children nodes; a curve is a list of lists (a list of splines, each with a list of knots). We won’t cover such a conversion here, but information can be found at this Blender Stack Exchange thread. Bendy bones open up even more possibilities.
It’s important to note that some properties of a bone are set through the armature’s pose (manual, Python API); others, through editing the armature’s data (manual, Python API). More info can be found in the scripting reference’s gotchas section.
Visualize Motion from Armatures

Working in the other direction, suppose we wished to display the key-frames of motion capture data as curves. We sample fluid motion in time as discrete slices, much like the chronocyclegraphs of Frank B. Gilbreth. These slices may then be displayed simultaneously.
First, we import motion capture data from a Biovision Hierarchy (.bvh) file. For this example, Ohio State University’s Motion Lab is our source.
For the import routine (manual, Python API), we may choose an armature’s world orientation, scale and whether or not it alters a scene’s duration. Although we are free to choose rotation mode, for animations, quaternions are generally better than Euler angles.
We first loop through the skeleton and gather the data we want. For example, to find how ‘deep’ a bone is in the hierarchy, for example, how many parent bones are between the hips and the finger tips, we measure the length of parent_recursive. To display the data, we create the following:
To loop through both the key frames in the bone data and the knots in our curves simultaneously — both lists should have the same number of elements — we aggregate them with the zip function. The hue is mapped to the depth of each bone relative to the maximum depth of the skeleton.
We have a few options to animate the curves themselves. The approach above animates the taper curve. Another would be to set key frames for the curve geometry’s bevel start and/or end (manual, Python API) and then make sure we map the taper (manual, Python API). This approach is explored by Art in Motion Studios in the video Curves and Strokes Blender tutorial. Depending on which approach we take, and how we handle materials, it may be more convenient to create many curves (as above) or one curve with many splines.